The notebook is the bottleneck
In module 1 we scaled the shop by hiring more workers and opening more shops. That worked because workers are interchangeable. The notebook is not. Every shop writes into the same notebook, because there is only one truth about who ordered what.
This is the whole difficulty of module 2 in one sentence: you can copy the workers, but you cannot casually copy the truth. Everything in this module - indexes, replicas, shards, caches - is a different trick for taking pressure off that one notebook without ever letting two shops disagree about what's in it.
So start where the pressure lands. A database under load is almost never slow because it is 'weak'. It is slow because it was asked to do something enormously wasteful, thousands of times a second, and it obediently did.
Imagine it like this: The workers are interchangeable, the notebook is not. Ten shops can serve customers; ten notebooks would mean ten different versions of the truth.
- state
- - the data that must be remembered between requests - the truth the system keeps
- stateless
- - a part that remembers nothing between requests, so copies of it are interchangeable
The full table scan, or: reading every page
Ask the worker to find every order placed by customer 4171. Without an index, there is exactly one way to do it: open the notebook at page 1 and read every single line to the end. Ten million orders means ten million lines read, to hand back the four that matched.
That is a full table scan, and it is the single most common cause of a database falling over. It is not that the query is complicated. It's that the query is lazy in a way that costs the database everything, and you only feel it once the table is big enough.
You never have to guess whether this is happening. Every database will tell you exactly what it plans to do if you ask it with EXPLAIN. Learning to read that output is the highest-value skill in this lesson.
EXPLAIN ANALYZE
SELECT id, total_cents, created_at
FROM orders
WHERE customer_id = 4171;
Seq Scan on orders  (cost=0.00..189432.00 rows=4 width=24)
                    (actual time=0.412..842.115 rows=4 loops=1)
  Filter: (customer_id = 4171)
  Rows Removed by Filter: 9999996
Planning Time: 0.081 ms
Execution Time: 842.196 msSeq Scan means it went page by page. Rows Removed by Filter: 9999996 is the database admitting it read ten million rows and threw away all but four. 842 milliseconds - for four rows.One slow query is survivable. The danger is that it holds a connection while it runs. At a hundred requests a second, a 900ms query means ninety connections are busy at all times - and when the pool runs out, requests that would have been fast start failing too. A single unindexed column can take down a page that never touches that table.
- full table scan
- - reading every row in a table because there's no faster path to the ones you want
- EXPLAIN
- - asks the database to describe its plan instead of running it blindly
An index is the back-of-the-book index
Take a textbook and find every page mentioning 'photosynthesis'. You do not read the book. You flip to the index at the back, find the word - already sorted alphabetically - and it hands you the page numbers.
A database index is exactly that, and it works for exactly the same reason binary search worked in the DSA course: the entries are kept sorted, so the database can throw away half the remaining possibilities with every comparison. Ten million rows becomes about twenty-three steps.
The cost is honest and worth knowing. The index is a second structure that must be kept up to date, so every INSERT and UPDATE now does a little more work, and the index takes real disk space. You are buying fast reads with slightly slower writes.
CREATE INDEX idx_orders_customer ON orders (customer_id);

EXPLAIN ANALYZE
SELECT id, total_cents, created_at
FROM orders
WHERE customer_id = 4171;
Index Scan using idx_orders_customer on orders
    (cost=0.43..8.51 rows=4 width=24)
    (actual time=0.031..0.034 rows=4 loops=1)
  Index Cond: (customer_id = 4171)
Planning Time: 0.104 ms
Execution Time: 0.058 ms
Seq Scan became Index Scan, and Rows Removed by Filter is gone entirely - it no longer reads rows it doesn't want. 842ms became 0.058ms: roughly 14,000 times faster, from one line of SQL.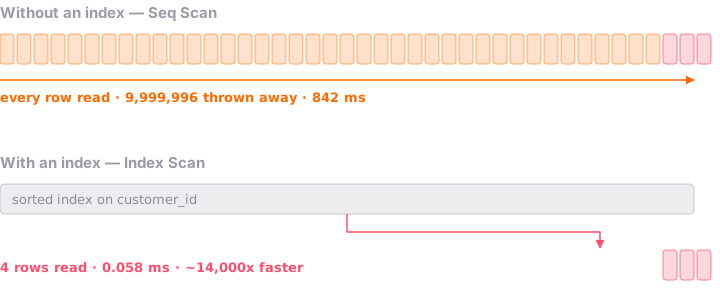
The rule of thumb: anything that appears in a WHERE, a JOIN, or an ORDER BY is a candidate. Do NOT index every column - each one slows writes and eats disk. Index what you actually query.
- index
- - a sorted lookup structure that finds rows without reading the whole table
- index scan
- - the plan where the database jumps straight to matching rows
Connection pools: the counter has limited stools
A database connection is not free. Each one costs the server memory and a process or thread to service it. A Postgres box happily handles a hundred; at ten thousand it spends all its time switching between them instead of answering anyone.
So the counter has a fixed number of stools. A connection pool is the rule that says: our app may occupy at most N stools, and a request that wants one when all N are taken must wait its turn. The pool doesn't make the database faster - it stops your app from stampeding it.
This is why the previous section mattered so much. Pool size and query duration multiply. Twenty stools and a 5ms query serves four thousand requests a second. The same twenty stools with that 842ms scan serves twenty-three.
pool_size = 20

def throughput(query_ms):
    """Requests per second this pool can sustain."""
    return pool_size * (1000 / query_ms)

print(round(throughput(5)))     # the indexed query
print(round(throughput(842))) # the full table scan4000 24
- Connections are a scarce, expensive resource - pool them
- Throughput = pool size x (1000 / query milliseconds)
- A slow query doesn't just make one page slow; it starves everything
- Fix the query before you raise the pool size
- connection pool
- - a fixed set of reusable database connections shared by all requests
- pool exhaustion
- - every connection is busy, so new requests queue or fail
N+1: the slowest fast query
There is one more pattern worth naming, because it hides from every dashboard. You fetch fifty orders in one quick query. Then, to show each order's customer name, your code loops over them and fetches the customer - fifty more queries.
Each of those fifty is fast. Individually they look perfect: indexed, sub-millisecond, nothing to see. But the page now makes fifty-one round trips to the database, and network latency is charged fifty-one times. This is the N+1 query, and it is probably the most common performance bug in web applications.
The fix is to ask once for everything you need, rather than asking once per row.
-- N+1: one query, then one MORE per row (51 round trips)
SELECT id, customer_id FROM orders LIMIT 50;
SELECT name FROM customers WHERE id = 4171;
SELECT name FROM customers WHERE id = 2280;
-- ...48 more

-- Fixed: one round trip, the database does the joining
SELECT o.id, o.total_cents, c.name
FROM orders o
JOIN customers c ON c.id = o.customer_id
LIMIT 50;
51 queries, 5 ms each, 30 ms network each  ->  1785 ms
 1 query,  9 ms,      30 ms network        ->    39 ms
- N+1 query
- - one query for a list, then one more for each item in it
- round trip
- - one full journey from app to database and back, paid in latency every time